How To Creating a Column Chart or Bar Chart in Excel

Oct 24, 2020 • edited Oct 25, 2020

How To Creating a Column Chart or Bar Chart in Excel

A bar chart is the horizontal version of a column chart. Use a bar chart if you have large text labels.

To create a bar chart, execute the following steps.

1. Select the range A1:B6.
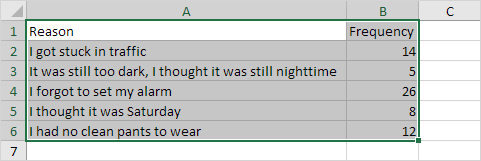
Select a Range in Excel

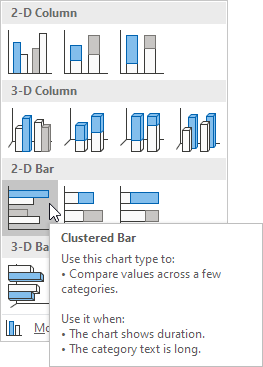
2. On the Insert tab, in the Charts group, click the Column symbol.

Insert Bar Chart

3. Click Clustered Bar.

Click Clustered Bar

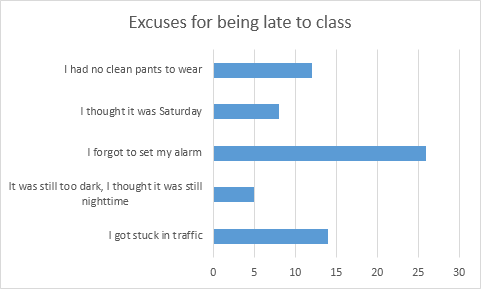
Result:

Bar Chart in Excel

#Tutorial#How To#Data Analysis#Charts

How to Create Data Form In Excel

How To Use Assignment Problem In Excel