Conditional formatting in Excel lets you automatically apply formatting (like colors or styles) to cells based on their values or specific conditions. You can use built-in rules or create custom formulas to control how cells are highlighted.
Table of Contents
Highlight Cells Rules
To highlight cells that meet a specific condition, such as being greater than a certain number:
- Select the range (for example, A1:A10).
- Go to the Home tab and click Conditional Formatting in the Styles group.
- Choose Highlight Cells Rules → Greater Than.
- Enter a value (e.g., 80) and pick a formatting style.
- Click OK.
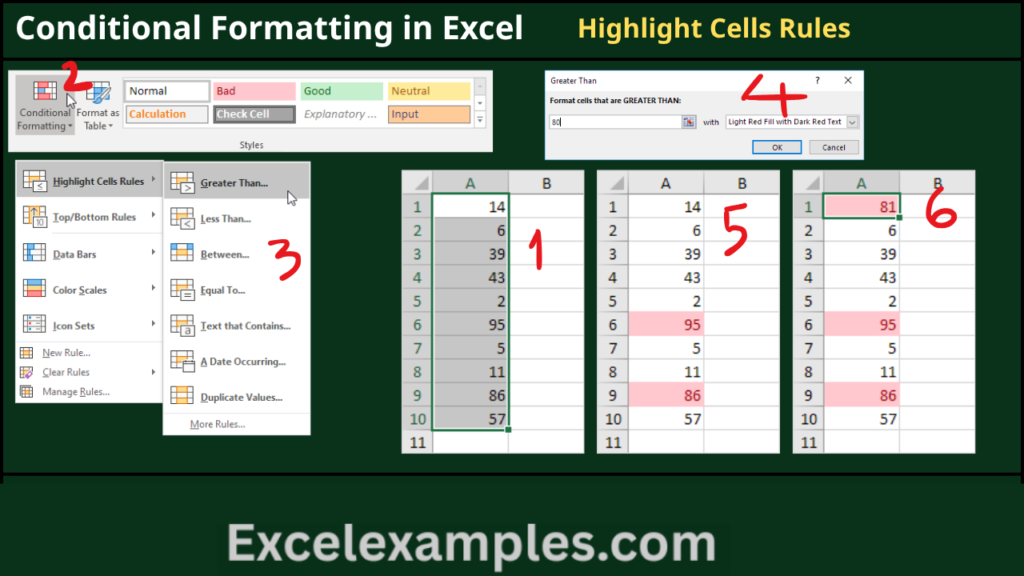
Now, all cells with values greater than 80 will be highlighted. If you change any value (e.g., update A1 to 81), Excel will automatically adjust the formatting.
You can also use this option to highlight cells that are less than, between, equal to, contain certain text, specific dates, or duplicate/unique values.
Clear Rules
To remove conditional formatting:
- Select the desired range (e.g., A1:A10).
- Go to Home → Conditional Formatting.
- Click Clear Rules → Clear Rules from Selected Cells.
Top/Bottom Rules
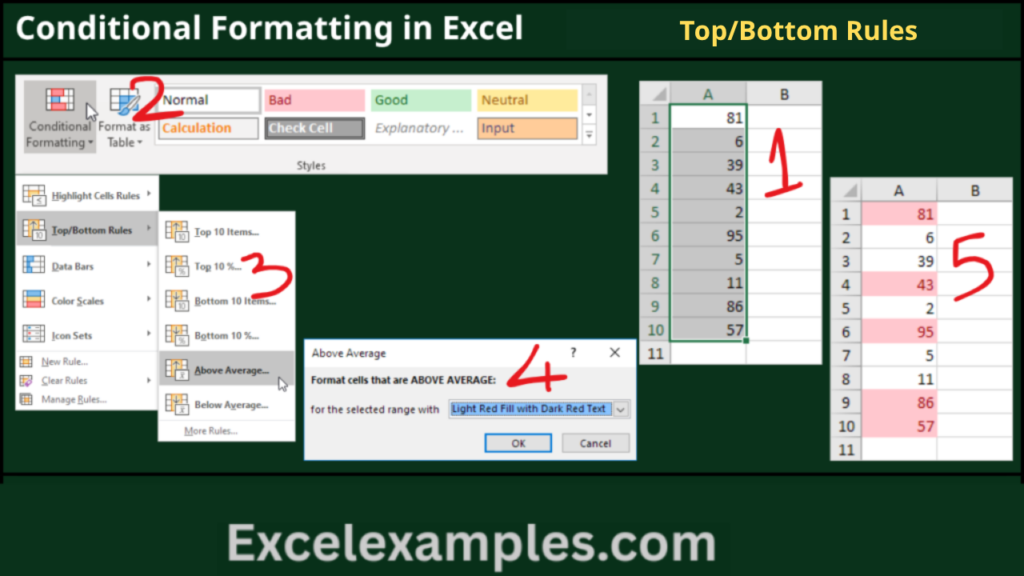
To highlight values based on ranking or averages:
- Select your range.
- Go to Home → Conditional Formatting.
- Choose Top/Bottom Rules → Above Average.
- Select a formatting style and click OK.
Excel will calculate the average and highlight values above it. You can also highlight top/bottom items, percentages, or values below average.
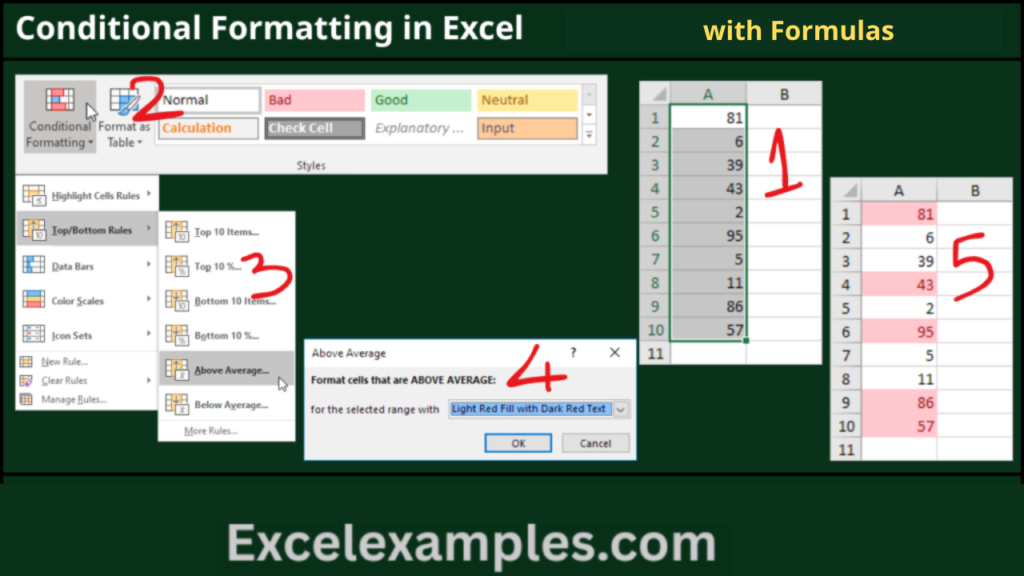
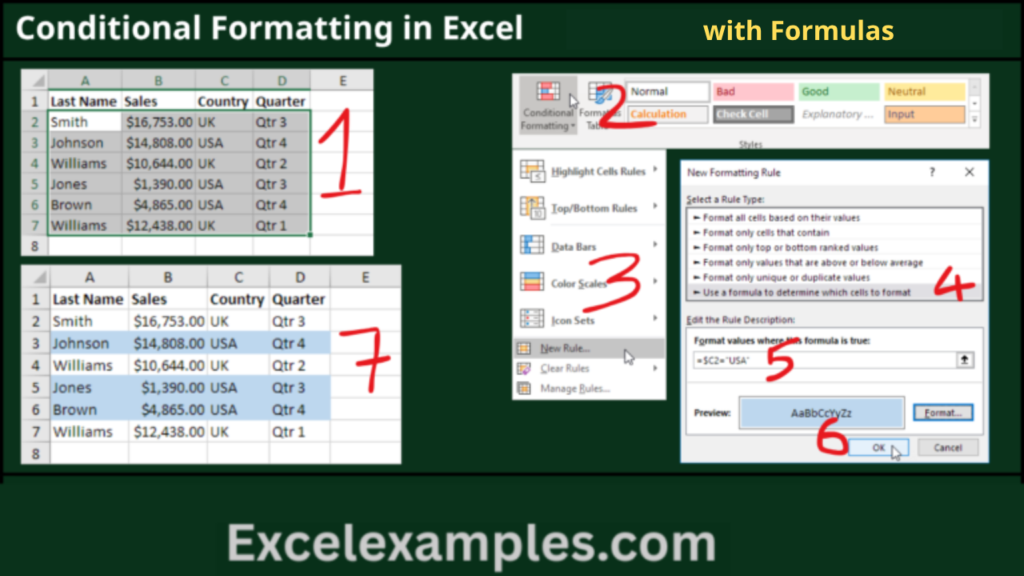
Conditional Formatting with Formulas
You can create more advanced rules using formulas that return TRUE or FALSE.
Example: Highlight odd numbers
- Select a range (e.g., A1:E5).
- Go to Home → Conditional Formatting → New Rule.
- Choose Use a formula to determine which cells to format.
- Enter the formula: =ISODD(A1)
- Choose a format and click OK.
Excel applies the formula relative to each cell in the selected range.
Another example: Highlight rows where column C equals “USA”
- Use the formula: =$C2=”USA”
The $ locks column C, so the rule applies correctly across each row.
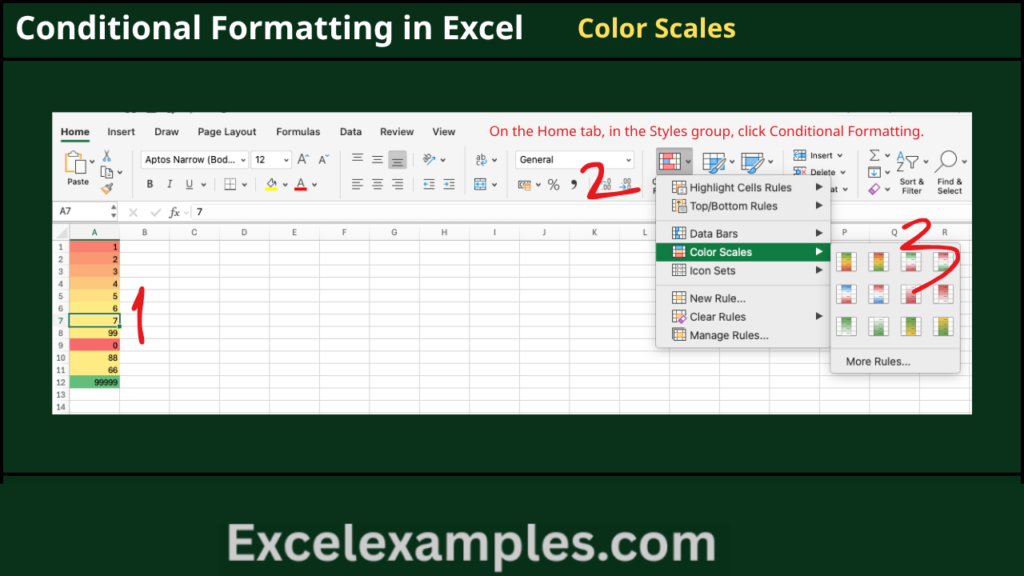
Color Scales
Color scales allow you to apply gradient colors based on values. This helps you quickly spot patterns, such as high and low values, often used in heat maps.
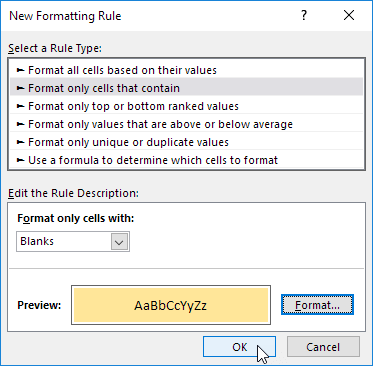
Highlight Blank Cells
Conditional formatting can also identify empty cells, making it easier to find missing data and ensure completeness in your dataset.